OpenStreetMap logo OpenStreetMap

Diary Entries in English

Recent diary entries

Posted by IrdiIs on 1 June 2024 in English.

Shushicë, according to Wikipedia, has a population of around 8,000 people as of 2011, which are the latest public statistics provided by the government of Albania. This village is quite significant in terms of its size and population, making it more comparable to a small city rather than a typical village.

Mapping Shushicë was a challenging task due to its vast territory and the dispersed nature of its small houses. The scattered settlements across a large area added to the complexity, making it difficult to ensure comprehensive coverage. For future projects involving villages of this size, I am considering utilizing a tasking manager to streamline the mapping process and ensure thoroughness.

Additionally, I found a short Wikipedia article about the village that could benefit from further improvements and updates. You can find the article here. Enhancing this article with more detailed information about Shushicë’s history, culture, and demographics would be beneficial for anyone looking to learn more about this unique village, so i encourage you to also contribute to Wikipedia.

” #100VillagesIn100Days #Day1 “

Location: 41.101, 20.139

Hello Fellow Mappers, My name is Henny Vianelde de Jesus Pires, and I am from Timor-Leste. I have been using OSM since 2022 and am currently participating in the OMGuru Fellowship 2024. I am excited to share how I got involved with open-mapping, what I find fascinating about the fellowship, my experiences, what I have learned, and how it has impacted me.

Introduction

Participating in the OMGuru fellowship has been a significant journey of learning and growth. As part of the validation track, I immersed myself in the world of OpenStreetMap (OSM), using various online platforms to ensure the quality of mapped data. This entry outlines my experiences, lessons learned, and the impact of my work.

How I Got Involved with Open-Mapping

My journey with open-mapping began in 2022 when I first heard about OpenStreetMap. The collaborative and open nature of OSM intrigued me, and I quickly became passionate about contributing to this global map. The idea of creating detailed and accurate maps accessible to everyone, and after hearing about the OMGuru Fellowship, I was particularly excited and it motivated me to get involved and learn more about the different aspects of mapping.

Fascination with the Guru Fellowship

What fascinates me most about the OMGuru Fellowship is the opportunity to connect with like-minded individuals who are equally passionate about mapping and geospatial technology. The fellowship provides a unique platform for learning, collaboration, and growth. Additionally, the focus on ensuring data quality in OSM is particularly gratifying. Contributing to the accuracy and reliability of mapped data not only enhances the usability of OSM for various platforms but also builds trust among its users. By validating and improving data quality, I feel that I am making a significant contribution to the global mapping community and supporting projects that depend on precise and dependable geographic information.

Defining My Experience as a Guru

My experience as a Guru has been a journey of exploration and mastery. I have learned to use various platforms like Tasking Manager, JOSM, Osmose, MapRoulette, and OSMCha to validate mapped data. This process has deepened my understanding of spatial data analysis and enhanced my technical skills. The supportive community and the guidance provided by the fellowship have been instrumental in my development.

Biggest Lesson or Achievement

One of the biggest lessons I have learned is the importance of persistence and adaptability. Navigating and mastering how to use platforms that were new to me, such as OSMCha or Osmose, was initially challenging, but these challenges have taught me to be resilient and resourceful. Ensuring the data quality from mappers is quite challenging. My biggest achievement is successfully overcoming these challenges and contributing to the quality and accuracy of the OSM data. Additionally, I have gained valuable hands-on experience that has broadened my professional skill set.

Impact of the OMGuru Fellowship in my Personal and Professional Life

Participating in the OMGuru Fellowship has profoundly impacted both my personal and professional growth. Through this program, I gained valuable hands-on experience with OpenStreetMap (OSM) and others mapping tools. This experience not only enhanced my technical skills but also broadened my understanding of spatial data analysis.

Conclusion

My OMGuru fellowship journey has been filled with learning, growth, and meaningful impact. From a proficient understanding technical skill and overcoming challenges, each aspect has contributed to my development. I want to express my deepest gratitude to OMGuru Fellowship for giving me this huge opportunity and I am grateful for this experience and eager to continue my journey in the world of mapping and beyond.

Contact me on:

  1. Email : henny.vianelde9799@gmail.com

  2. LinkedIn : Henny Vianelde J. Pires

  3. Facebook : Henny

Location: -8.563, 125.561

(Ελληνικό κέιμενο παρακάτω)

I’ve been dabbling with overpass today and wrote this query for correcting one of my biggest pet peeves in Greek name tags, the absence of stress accents. Since by the nature of the mistake it is often one out of thousands of street names and very subtle at a distance, it is quite hard to find manually, unless someone systematically added street names without stress accents on purpose in error. Maybe I should add these to the wiki page or make one for particularly Greek language examples.

Έπαιζα λίγο με το overpass σήμερα και έγραψα το παρακάτω query για τη διόρθωση ενός από τα μεγαλύτερα μου pet peeves στα ελληνικά tags για ονόματα, η απουσία τονισμού. Λόγω της φύσης του λάθους είναι συχνά ένα από χιλιάδες ονόματα οδών και αρκετά διακριτικό από μακριά, είναι αρκετά δύσκολο να βρεθεί με το χέρι, εκτός αν κάποιος συστηματικά βάζει ονόματα οδών χωρίς τόνους επίτηδες από λάθος του. Ίσως πρέπει να το προσθέσω στο wiki ή να κάνω σελίδα για ελληνικά παραδείγματα.

// gather results nwr ["highway"] ["highway"!="bus_stop"] ["name"] ["name"!~"ά"]["name"!~"έ"]["name"!~"ί"]["name"!~"ή"]["name"!~"ώ"]["name"!~"ό"]["name"!~"ύ"] ["name"!~"Ά"]["name"!~"Έ"]["name"!~"Ί"]["name"!~"Ή"]["name"!~"Ώ"]["name"!~"Ό"]["name"!~"Ύ"] ["name"!~"ΐ"]["name"!~"ΰ"] ({{bbox}}); // print results (._;>;); out meta;

Posted by IrdiIs on 1 June 2024 in English.

Albania’s mapping, especially in rural areas, is lacking. Villages, in particular, are often not mapped at all. To address this, I’ve set myself a challenge: to map 100 villages in 100 days. I’ve used tools like Overpass Turbo and a Python script to select these villages randomly. Below, I’ve listed the villages, although I haven’t checked if they are already mapped. In the event that a village on the list has already been mapped, I will replace it with another. I’ll update regularly on my progress.

  1. Shushicë (41.1008191, 20.1388668) ✅
  2. Vukël (42.4861958, 19.64735)
  3. Fitore (40.6320149, 19.4559282)
  4. Lapardha e Sipërme (40.7808255, 19.9537119)
  5. Përcëllesh (41.2874122, 19.9449583)
  6. Gjerë (40.9055141, 20.2940623)
  7. Faqekuq (40.5656368, 20.4054953)
  8. Qerret (41.3923154, 19.4917403)
  9. Stropckë (40.8534357, 20.6842592)
  10. Kullaj (42.1386724, 19.5262028)
  11. Kastriot (41.737124, 20.3791595)
  12. Mokricë-Zleushë (40.2992792, 20.3276938)
  13. Tenë (41.7855984, 19.9595356)
  14. Lavdar i Korçës (40.6027805, 20.6556642)
  15. Arrëz (40.5005086, 20.8421665)
  16. Lapulec (40.6288454, 19.7373071)
  17. Kuzhnen (41.8980834, 19.9670947)
  18. Kotorr (40.9265281, 20.1673374)
  19. Kafaraj (40.6364502, 19.5117088)
  20. Shtëpëz (40.2158767, 20.069172)
  21. Frashër (40.3661283, 20.4281963)
  22. Jaran (42.26793, 19.4481678)
  23. Leminot (40.7941842, 20.6957944)
  24. Perkola (41.4464692, 19.9303746)
  25. Hajdaraj (40.9589557, 19.7221109)
  26. Kaftall (41.9452335, 19.7686687)
  27. Vesqi (41.1750169, 19.8248392)
  28. Zdojan (41.6879927, 20.3797589)
  29. Kosovë (40.8998168, 19.8141917)
  30. Mushnik (41.1514842, 19.6657204)
  31. Alarup (40.864066, 20.7950294)
  32. Gllavë (40.4893239, 19.9653888)
  33. Shënepremte (41.0272906, 19.5457236)
  34. Xhan (42.2506701, 19.6490827)
  35. Floq (40.5081269, 20.7154456)
  36. Vlashaj (41.5316376, 20.4055941)
  37. Llëngë (40.8864156, 20.5007392)
  38. Renz (41.7545162, 20.3830977)
  39. Demiraj (42.1811321, 19.4751039)
  40. Slatinjë (40.481813, 20.1713576)
  41. Radesh (40.5389203, 20.2550814)
  42. Gradec (42.2547977, 19.4617091)
  43. Fushëz (40.7865358, 20.264107)
  44. Rashtan (40.8801918, 20.3259025)
  45. Duhanas (40.7233908, 19.9954468)
  46. Saraqinisht (40.1055965, 20.2304735)
  47. Tomin (41.6906338, 20.4210429)
  48. Kryemadh (42.0895508, 20.2911894)
  49. Grykë-Manati (41.7791296, 19.6790894)
  50. Mushan (41.9773281, 19.4351608)
  51. Rushkull (41.980251, 19.3969448)
  52. Mjedë (42.0017697, 19.6148898)
  53. Qazim Pali (40.0478302, 19.855221)
  54. Bezhan (40.4215687, 20.7353506)
  55. Mesul (41.9489498, 20.0499793)
  56. Cerjan (41.7134663, 20.4824473)
  57. Bishqem (41.0699913, 19.8672447)
  58. Papër (41.0538876, 19.9569239)
  59. Pac (42.2900815, 20.2034059)
  60. Gjergjan (41.0387886, 20.0139255)
  61. Kaçinar (41.8012625, 19.6949146)
  62. Romës (40.5595996, 19.6816829)
  63. Selckë (40.1088656, 20.2968363)
  64. Bukmirë (41.8389148, 19.868848)
  65. Bubq (41.4713963, 19.6545539)
  66. Mengël (41.1202355, 20.1188463)
  67. Gjokaj (41.3587642, 19.6738825)
  68. Nangë (42.0105618, 20.4164814)
  69. Ngraçan (40.646106, 19.7962679)
  70. Bishqethem (40.8695061, 19.6591411)
  71. Baz (41.6286658, 19.9304945)
  72. Memaliaj Fshat (40.3452031, 19.9764133)
  73. Plan (42.2894757, 19.693757)
  74. Kujtim (41.5591781, 20.0601065)
  75. Poçestë (40.6842812, 20.7179655)
  76. Velahovë (39.9054826, 20.1531553)
  77. Tharri (41.7343178, 19.9859391)
  78. Matranxhë (41.8637241, 20.4212978)
  79. Vorrozen (41.1431628, 19.5634312)
  80. Levan (40.6206191, 19.8556674)
  81. Pilur (40.6638888, 20.9162806)
  82. Kodër (40.2747186, 20.065531)
  83. Bllatë e Poshtme (41.5623971, 20.477637)
  84. Toç (40.417205, 19.8675563)
  85. Skrevan (40.7505737, 19.8250009)
  86. Arn i Epërm (41.6405756, 20.3047777)
  87. Lofkend (40.6448336, 19.7453692)
  88. Ogren-Kostrec (40.3163612, 20.4498636)
  89. Lenmushë (40.721556, 20.2431292)
  90. Rrashtan (41.0485117, 20.512638)
  91. Raban (40.3410655, 20.3132609)
  92. Skënderbej (41.1340621, 20.5638372)
  93. Kuç (40.1742689, 19.8389532)
  94. Jezull (41.7445468, 19.817449)
  95. Ujëmirë (40.3873621, 20.1341224)
  96. Shpatanj (40.6591601, 20.2200733)
  97. Unnamed village (41.6811445, 20.3302903)
  98. Rusinjë (40.6784764, 19.6717383)
  99. Tremul (39.8654747, 20.0849958)
  100. Arrëz (40.2520032, 20.6924267)
Posted by Candid Dauth on 1 June 2024 in English.

I really missed Openptmap ever since the service stopped working a few years ago. It was an important feature of FacilMap that I had used frequently in my daily life. This is why I have decided to invest in a bigger server to be able to render and host the tiles myself.

I have set up a tile server with the original Openptmap styles on https://pt.facilmap.org/. You can browse the tiles through FacilMap.

For now, tiles are generated when first requested, so rendering the map will be very slow when a region is first accessed. Also, there are no automatic updates of the map yet, so for now the state of the map will be frozen in time. When I find the time, I want to bring the setup up to date to enable automatic updates. If you have the skills and want to contribute, what would be needed would be to rewrite the filter and style into an osm2pgsql flex output Lua script.

If you find this service useful, a financial contribution would be greatly appreciated.

Welcome to the ninth OpenStreetMap NextGen development diary.

This week was focused on providing final touches to the core system. Within the few days I’ll publish details on how to get started contributing! Keep an eye for a dedicated diary entry 🙂/.

🔖 You can read my other development diaries here:
https://www.openstreetmap.org/user/NorthCrab/diary/

⭐ This project is open-source and publicly available:
https://github.com/Zaczero/openstreetmap-ng

🛈 This initiative is not affiliated with the OpenStreetMap Foundation.

Let’s jump into this week’s highlights.

macOS and ARM support

OpenStreetMap-NG development environment has received MacOS support. Meaning that it can now be developed on Linux, MacOS, and Windows through WSL2. The installation instructions are the same for all platforms and contain just a single step: install and run nix.

Changesets History Refresh

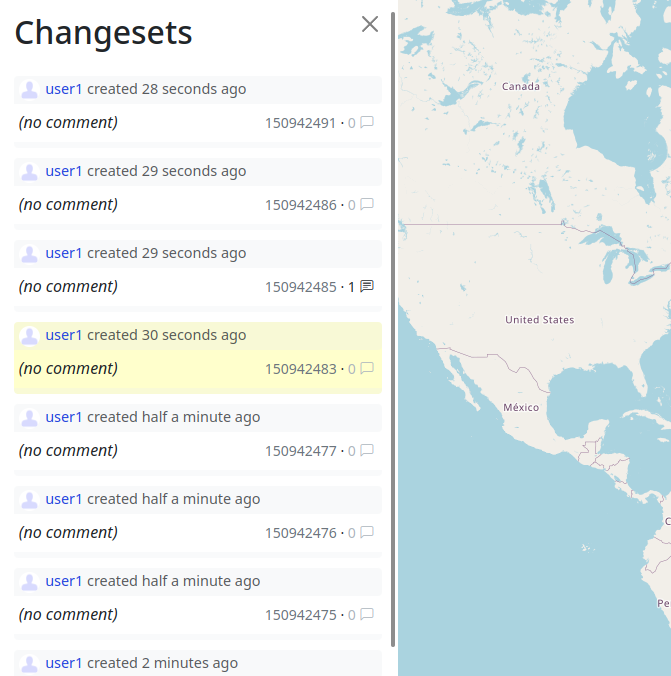
The changesets history sidebar has received a design refresh. It is now consistent with the overall style language of the OSM NextGen. It now also includes infinite-scroll functionality! The data loads as you scroll, no more clicking the “load more” button.

GPS Trace Animations on Hover

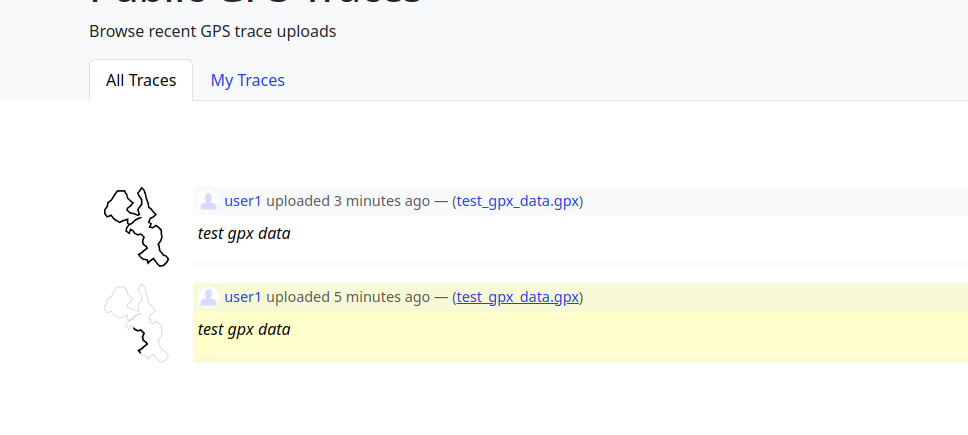
The next generation trace animations are now also displayed in the list view. Simply hover over the entry to see it in action. Previously, the animations were part of the individual trace details page.

Rendering a complete animation in the browser takes about 0.5 ms. It’s really quick and requires no additional data download.

General Refactoring & Fixes

With the first development release approaching quickly, this week I focused on doing finishing touches to many of the core components. It’s important to perform such edits now, to avoid conflicts with other contributors work in the future.

Project Sponsors 🏅

I want to thank all the project patrons. Thank you for your help in building the next generation maps!

This week work has been sponsored by 13 people!
Four private and four public donors on Liberapay, and five public on GitHub Sponsors.

If you can, please consider supporting the OpenStreetMap-NG development.

Donate using Liberapay

A simple "shortbread" / "VersaTiles Colorful" maplibre-gl vector map

Lots of people have written diary entries and there have been other announcements and demos. You might wonder why we need another?

The idea of this is to provide a “soup to nuts” guide in a similar style to the existing “Switch2osm” Serving Tiles guides for raster tile servers.

Introduction

There are two major pieces to this. The first piece creates a set of vector tiles that can be served by a web server. The second provides a way for clients to access that data - and clients also decide how to display it.

The code in this example is for web clients, but it’s also possible to create other sorts of clients too (for example, Android or iOS apps).

One important choice is “what data should be in in the vector tiles, and at what zoom level”. It’s not possible to have everything in OSM available at every zoom level - the size of each tile would just get impractically large. Handily, people have already created schemas that target different use cases. One general purpose one is shortbread.

That documentation doesn’t just define what data is in the tiles, it also covers how to create them. The actual software used to create the tiles is Tilemaker. The documentation of both of those is pretty much good to follow directly - what follows below is basically just a worked example.

As an example map style, I’ve used “colorful” from VersaTiles. The implementation below differs slightly from the examples on VersaTiles’ site, in order to make it clearer how it all works together; but do be aware that that site offers a lot more than just a couple of web vector map styles.

Setting up a server

As a test server I chose a CAX21 at Hetzner - that has enough memory and disk for the worked example below, and is relatively cheap (€0.25 a day or so). Other cloud providers are available; and of course machines with this sort of specification is going to be available to many people locally too.

I chose Debian 12 as the operating system, selected IPV4 + IPV6, added my ssh keys, made a name up, and added that as a fully qualified domain name to my DNS. I then created a non-root account for “normal” usage and added it to the “sudo” group. I turned off password access to ssh and forced all logins to use ssh keys.

I installed some initial software

sudo apt install emacs-nox mlocate screen git tar unzip wget bzip2 apache2 socat net-tools curl

In that list “emacs-nox” is just my preferred editor and “socat” is used when obtaining an SSL certificate for the web server which we’ll cover below. They’re just peripheral to serving tiles.

At this stage browsing to “http://myserverFQDN” (obviously use your name instead of the text “myserverFQDN”) should display an “it works” page.

sudo apt install postfix mailutils

Also peripheral to the main job in hand, “postfix” is a mail server and “mailutils” provides command-line mail access. These are useful on a remote server for reporting when e.g. scripts have failed, but are less essential if the server is local. When installed, postfix asks how mail should be sent (“Internet Site” in this example) and what the mail name should be (I used the FQDN from earlier).

With an internet-facing server with a known name it’s easy to obtain a free SSL certificate using a service such as Letsencrypt or ZeroSSL. I used acme.sh for this, but there are lots of other options. Once I had the certificate files I then ran:

a2ensite default-ssl
a2enmod ssl

and edited “/etc/apache2/sites-enabled/default-ssl.conf” to add

SSLCertificateFile      /root/.acme.sh/myserverFQDN_ecc/fullchain.cer
SSLCertificateKeyFile   /root/.acme.sh/myserverFQDN_ecc/myserverFQDN.key

below “documentroot”, and then ran “systemctl reload apache2”.

Browsing to “https://myserverFQDN” now works without an SSL error or warning. I set up an iptables firewall to block access that I didn’t want but allow e.g. web and ssh traffic, over both ipv4 and ipv6. Various online guides exist, including this one. When you’re happy that both ipv4 and ipv6 are configured correctly:

sudo apt install iptables-persistent

and say “yes” to saving both ipv4 and ipv6 rules.

Shortbread and Tilemaker

When logged in as the non-root user you created above, we’ll need to install some prerequisite software:

sudo apt install gdal-bin apache2-dev libsqlite3-dev

and then obtain some other software that needs building. First, “mod_mbtiles” is an add-on to apache to allow it to server vector tiles.

cd
mkdir src
cd src
git clone https://github.com/systemed/mod_mbtiles
cd mod_mbtiles
sudo apxs -lsqlite3 -i -a -c mod_mbtiles.c
sudo systemctl restart apache2

Next, get shortbread-tilemaker, which defines the schema that we’re using - it comes with the rules that Tilemaker will follow.

cd ~/arc
git clone https://github.com/shortbread-tiles/shortbread-tilemaker

and then Tilemaker itself

cd ~/src
git clone https://github.com/systemed/tilemaker

Now we need to build tilemaker locally as described here.

sudo apt install build-essential libboost-dev libboost-filesystem-dev libboost-iostreams-dev libboost-program-options-dev libboost-system-dev liblua5.1-0-dev libshp-dev libsqlite3-dev rapidjson-dev zlib1g-dev
cd ~/src/tilemaker
make
sudo make install

Next, download some data. I’m going to use “Britain and Ireland” from Geofabrik. At the time of writing this (just) fits into this specification of server.

cd
mkdir data
cd data
wget https://download.geofabrik.de/europe/britain-and-ireland-latest.osm.pbf

We need some “background data” - there’s a script to get that in the “shortbread-tilemaker” directory:

cd ~/src/shortbread-tilemaker
time ./get-shapefiles.sh

We can now run tilemaker. The bounding box here covers most of Europe (it needs to be bigger than our data download area). Generating tiles for the whole world takes much longer so we won’t do that. Use Geofabrik’s tile calculator to choose appropriate values.

cd ~/src/shortbread-tilemaker
time tilemaker --config config.json --process process.lua --bbox -11.39,48.44,2.28,61.36     --input ~/data/britain-and-ireland-latest.osm.pbf  --output ~/data/shortbread-tiles.mbtiles

When generated, copy the tiles into the web server drectory

sudo cp ~/data/shortbread-tiles.mbtiles /var/www/html/

and edit your appache config files (by default, “000-default.conf” and “default-ssl.conf”) to add:

MbtilesEnabled true
MbtilesAdd shortbread-tiles /var/www/html/shortbread-tiles.mbtiles

below “DocumentRoot”, and restart apache.

VersaTiles Colorful

One of the examples listed above, Paul’s TileKiln demo includes VersaTiles “colorful” style. We’ll fetch a copy of that and edit it to work with our tiles. As your non-root user:

cd ~/src
git clone https://github.com/pnorman/tilekiln-shortbread-demo
cd tilekiln-shortbread-demo
wget https://demo.tilekiln.xyz/shortbread_v1/tilejson.json

Open “colorful.json” in a text editor. This definition:

"glyphs": "https://tiles.versatiles.org/assets/fonts/{fontstack}/{range}.pbf",

defines where fonts (for text styles) are loaded from. It defaults to VersaTile’s own site, which is fine for the purposes of this demo. This definition:

"sprite": "https://tiles.versatiles.org/assets/sprites/sprites",

defines where all the icons on the map come from. They’re all in one big “sprites.png” file and a separate “sprites.json” file defines which one is where.

Finally, edit the line

"url": "https://demo.tilekiln.xyz/shortbread_v1/tilejson.json"

to instead read

"url": "https://myserverFQDN/tilejson.json"

(or “http” if you have not set up an SSL certificate for your website) We’ll also edit our local copy of “tilejson.json” to replace

["https://demo.tilekiln.xyz/shortbread_v1/{z}/{x}/{y}.mvt"]

with

["https://myserverFQDN/shortbread-tiles/{z}/{x}/{y}.pbf"]

That “shortbread-tiles” matches the name in the “mod_mbtiles” confguration above

Next copy “index.html” and your modified “colorful.json” and “tilejson.json” to the root of your web server “/var/www/html”. Restart apache and start a new private browser.

Browse to

https://myserverFQDN/index.html#18/54.501519/-8.190062

and you should see a map!

If you don’t, then something has gone wrong. After correcting whetever it is, you’ll probably need to restart Apache and/or close your private browser and restart it. Browser web developer tools (often control / shift / I), especially the “network” tab, can be helpful at understanding what has gone wrong.

Location: 54.390, -8.130
Posted by Zverik on 29 May 2024 in English.

I make Every Door to be the best on-the-ground surveying app. Its focus has always been shops and amenities, but it’s summer now! Ride a bike outside a city, take a scenic route. And bring Every Door with you, because it is ready for outdoor adventures.

Today version 5.1 has been published to both major app stores, and soon on the rest. Here’s what the app learned to do in May:

Every Door app with scribbles drawn on top of a satellite imagery

We have always had map notes, but now you can draw on the map! Saw an unmapped track road or a stream? Open the 4th mode in Every Door, unlock the scribble mode, choose the type and draw with your finger. This goes to a separate database, which you can then use in JOSM or Rapid.

Read this wiki page to learn how it works and how to add the layer to your editor.

Every Door map with a dotted blue track line on top of OSM map

To help you draw better lines and orient yourself, Every Door now shows a part of your recent track. It only records when the app is open, so use OSM Tracker or a different app or device to record your full track.

Every Door editor for a building with a "Demolished" button

Found a mapped building that’s missing on the ground? Tap it in the 3rd mode, then choose “More…” and mark it demolished with the new button! Every Door still only works with point geometries, but it would use the demolished:building tag, which is the most correct according to OSM wiki.

Opening hours editor with all messages in English, but weekdays in Estonian

On a vacation in another country? I remember how at SotM 2022 we were in Italy, and I had trouble reading opening hours for shops and restaurants. L-G? Ma, Me? Yeah no, couldn’t map that at all. But now Every Door shows weekday abbreviations in the language of the country you’re in! E is for Esmaspäev, Monday in Estonian.

QR Code button near the website field

Typing in website addresses is tedious, and even more frustrating when a QR code is right there. Now there’s a button for scanning the code! It automatically sorts the URL into the proper tag, be it contact:instagram or just website. Maybe someday it could parse text from photos as well…

Amenity editor for Jysk with two unchecked floors: 1 and 2

I use Every Door to quickly survey hundreds of amenities, and this one thing has been bugging me: for every new building I had to enter both addr:floor and level tags, remembering how floors are numbered in the country. Now Every Door looks around and suggests values, so you can mark the shop’s floor with a single tap.

These are just the highlights of numerous changes that went into releases 5.0 and 5.1, published in May. Read the full list in the changelog, or just go ahead and update the app.

If you’re new, the official website is the place to start. Download the editor and go map something!

Two months later I’ve made my way deeper into a lot of OSM development of the last decade, learning changeset comments, OSM notes, catching up with recent tagging style and trends and using street imagery tools.

I tried to fix issues documented in OSM data as well as from the OSM notes map layer. After some quick wins I got challenged by tasks like merging dozens of tags and bus relations when merging split directions of Schandauer Straße in Pirna back to ‘ground truth’ - a 4/5-lane marked primary town highway. Destination tagging had been try-n-error before stepping into OSM community forum. That opened a wide pool of expertise and discussion supplementing the more authoritative wiki documentation, especially tools for reconstruction/QA of destination tags into visual form of road signs.

Tempted to photo-document rather than note down observations I joined Mapillary street imagery. It feels like a great tool for cheap document including sharing recent changes and situation in the field to fellow mappers. Despite of my rather basic equipment - mapillary app on mobile - I enjoyed looking at 360-degree-photograph-series of some very active contributors. These images look amazing and seem like the way to go.

Recently I made my first steps to preserving history in OpenHistoricalMap, the spin-off for information, that cannot and shouldn’t be preserved by current OSM life-cycle tagging. There is not much information in my area yet and a lot of discussion regarding rather basic mapping techniques. It feels like the pioneer days in OSM back in 2008.

More to come …

Magical world of mapping through OpenStreetMap and Wikidata

The possibilities for integration between these two platforms are incredibly vast, and I genuinely feel as if I had progressed quite a lot in the understanding and contributions I make

Date: May 20, 2024

I started my morning by getting familiar once again with OSM. I invested time in updating and linking the wards in Kerala with Wikidata. I noticed that there was some wards in OSM that are not linked to Wikidata and some issues with the names and ward numbers. Using Sparql query I downloaded the Qids from Wikidata and using QGIS I downloaded the OSM relations ids. Then using OpenRefine I cleaned up the data and matched the OSM and Wikidata entries. Using JOSM, I added the Qids to OSM relations.

Posted by Juicio on 27 May 2024 in English. Last updated on 31 May 2024.

Panoramax

Panoramax view feature improves map exploration and gives users access to 360-degree imagery that enhances the mapping process and gives important visual context.
The community gains access to a potent tool that improves map visualization and encourages increased engagement and participation in the mapping process.
Live images can provide a lot of information that can be hard to determine, such as the weather or the terrain condition.

Introduction

Hi I’m Mattia, one of the Google Summer of Code 2024 contributors. This journal will be updated weekly based on what is happening. If you want to see the individual stages you can check out the osm wiki. You can check the WIP code here

Week 1 (27/05 - 31/05)

This first week the focus was to understand how iD codebase works and how the already implemented street level service operate. In reality, things moved a little faster than anticipated.

After the first week we have a semi-operational environment:

  • The dot is displayed with the header cone.
  • Sequences are shown and bubbles of the same sequence are linked.
  • Panoramax flat images are displayed in the panel when the corresponding point is clicked.

Next week will focus on:

  • Implementing 360 images
  • Being able to move between images
  • Refactoring and checking the code for smells
  • Checking if the API is being used correctly

My OSM journey started in the year 2023 March 18. It was my first experience regarding the osm world. There was a project led by a Bhutanese female in the She Leads She Inspire challenge where they got a project on mapping hospitals and Basic Health Units in the Bhutan region. This was my first experience in OSM and am Thankful to Miss Kelzang Yuden and her team for this opportunity. Moreover, I thank Miss Leki Choden who encouraged me to join her team in mapping. From there onwards I always check the Asian Pacific Hub and Mr. Mikko’s Facebook account for OSM updates.

I saw the post regarding the OMGuru fellowship and I was excited and took the OMGuru exam on the first week of November, and I passed that exam and was selected for the fellowship. I felt like I was a lone person from Bhutan participating in this fellowship since I couldn’t find any Bhutanese name and I was selected for the mapping fellowship where are have to lock commitment for 5 months.

Through the journey of fellowship, I have learned much new knowledge regarding OSM mapping and new tools and software for mapping. moreover, got the opportunity to attend many webinars related to mapping, exporting, and mobile applications that are used to do mobile mapping like Mapillary, Every Door, and MapSwipe.

At the same time while doing mapping I faced lots of challenges such as a lack of clear visibility images, overcrossing buildings, managing time, and many more. In some cases, buildings are not visible to digitized as well as face difficulties in identifying between shadows and buildings. Since I am serving in one of the agencies in Bhutan facing difficulties in managing time between my professional work, academic work, and private work and I felt a bit challenged to complete my fellowship.

To date, I have done my work hearted and still trying to explore more GIS-related courses. Moreover, I enjoyed mapping and got ample opportunities to interact with unknown friends, and it’s a place to interact with friends.

Lastly look forward to continuing my work hereafter. I thank Asian Pacific Hub (APHub) and Mikko for this wonderful opportunity.

Location: 27.672, 91.181
Posted by Brazil Singh on 25 May 2024 in English. Last updated on 27 May 2024.

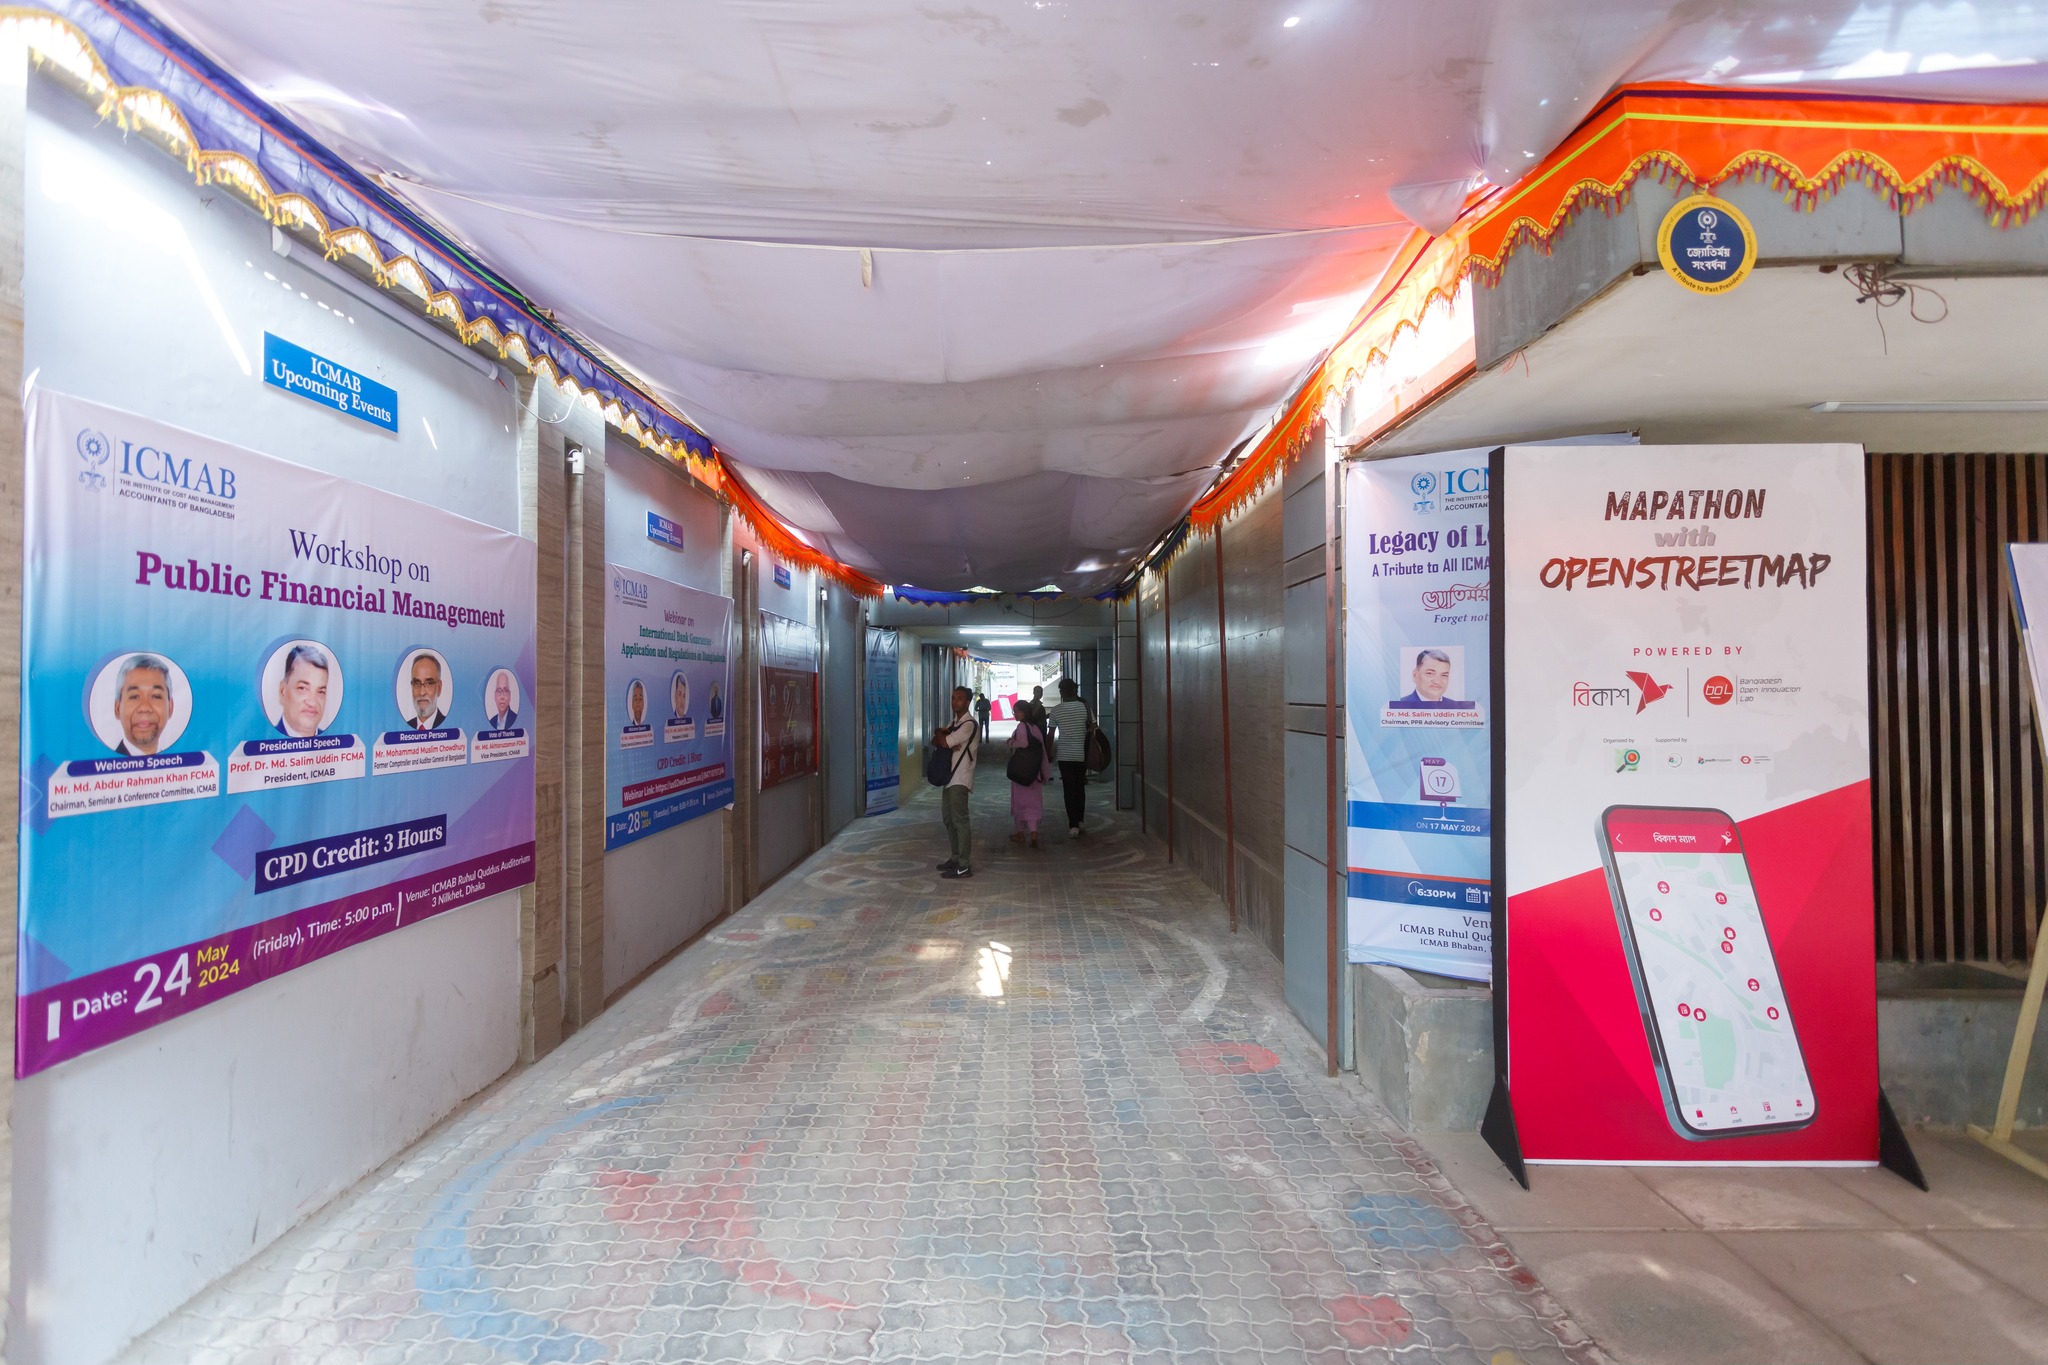
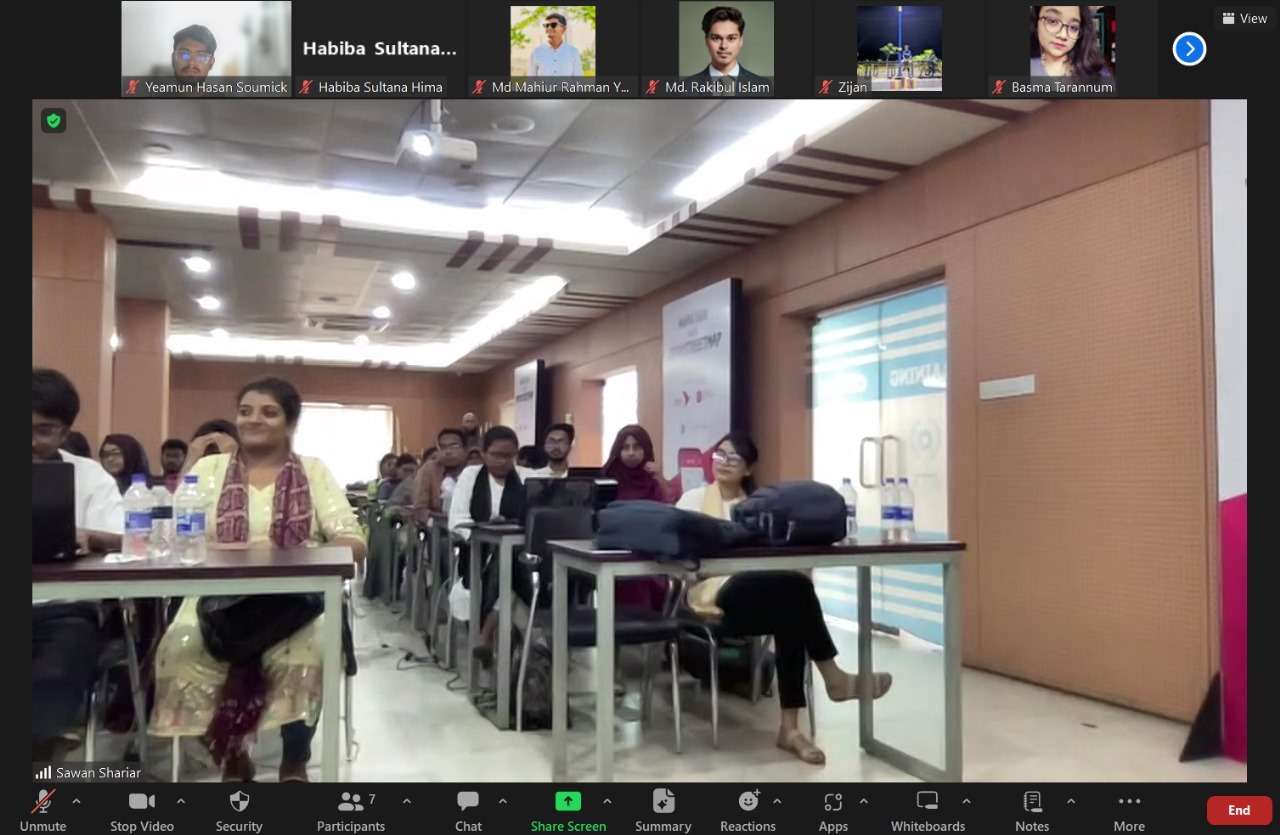
On May 24, 2024, OpenStreetMap Bangladesh Community organized a mega mapathon in Dhaka at ICMAB Training Center, Annex Building, Nilkhet Road, Kataban, Dhaka . OSMBD MEGA MAPATHON LOCATION

It was an amazing day. The event started at 09:00 am and ends at 4:00 pm with so many workshop, quiz, mapathon.A team from Rajshahi University joined with us virtually.

RU Team

The event was supported by Bkash and Bangladesh Open Innovation Lab. We started with snacks and our Youthmappers’ Regional Ambassador, Amena Rashid Bania, started the event with a new and exiting game. We separated into two lines and communicated with new participants, asked them about there hobbies, when did they join OSM, why they are interested and so many questions. It was a really fun and we learn so many things from this game. Actually how to interact with others and also how to express ourselves.

After that our main part started, which was mapathon, where we have given a project to map in HOT Tasking Manager. And the top contributors will get prize. Absolutely an amazing competition. During this competition we have had lunch and after lunch we again participated in Mapathon. And after that another interesting game which was Quiz competition. In the beginning I was in 53th number but from 7th round i was answering right and before last round i was in top position but the last question , I couldn’t answer that and end of the result I was in 4th place. But the game was really amazing. After the game, we learned so many things from precious speakers, who really gave us so many interesting and knowledgeable information.

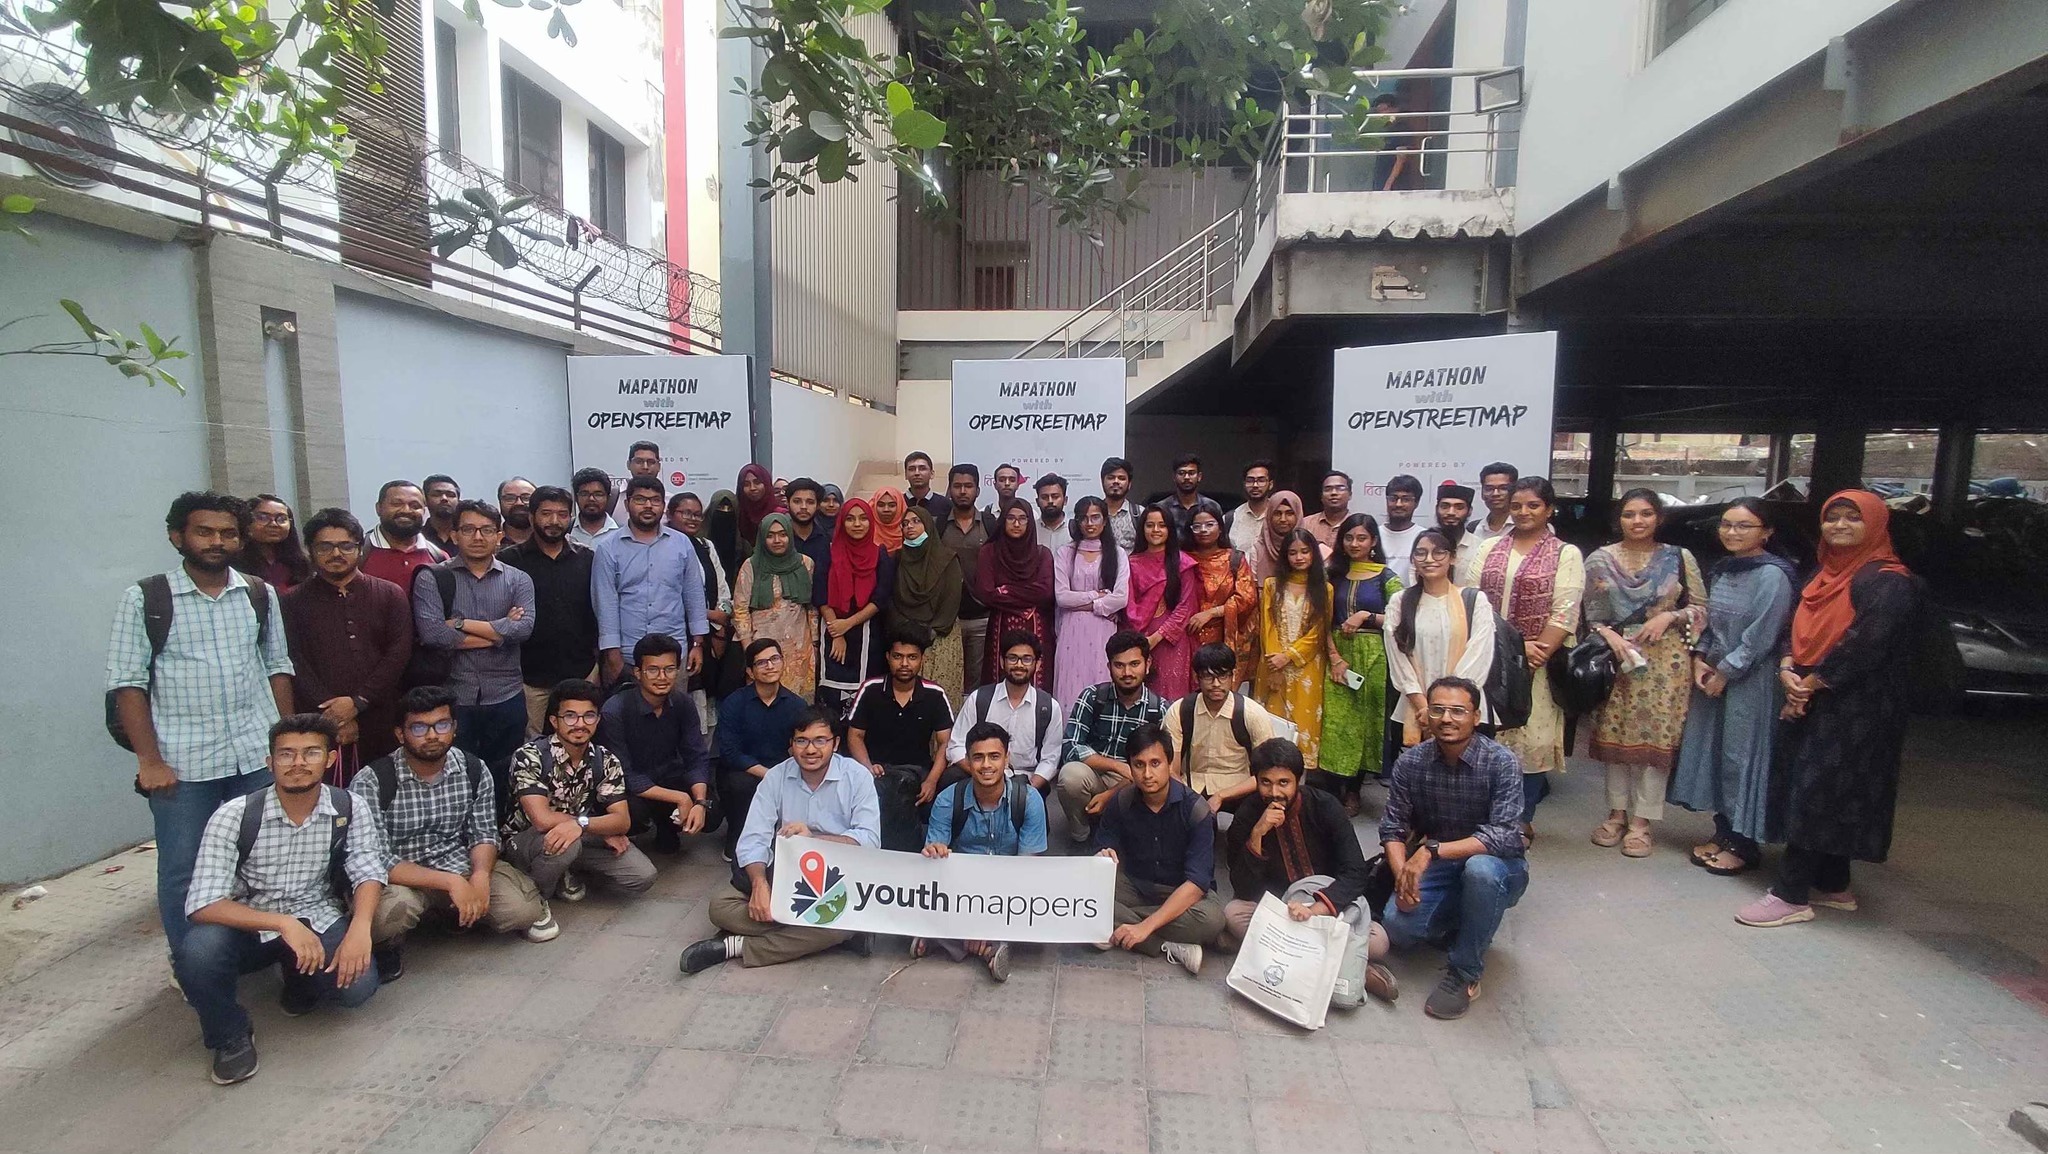
Image of OSMBD

After the closing ceremony, we gathered in group Infront of the venue and took group photo. Lastly, it was my first mapathon with OSMBD community and I heired before Covid-19, this type of event often happened. Again it’s starting, and I hope we will Experience so many events and new things in future. So, East and West, OSMBD community is best!

Posted by jmbatchelor on 25 May 2024 in English.

A trip to Wisley and I noticed that the new Clear Lake was not mapped at all. I only managed to walk around one side so it could do with some adjustment I’m sure. The Glass House Border has been re-landscaped into The Oudolf Landscape with new paths - I didn’t get the chance to map these, but hopefully someone will in the future.

Location: 51.310, -0.472

CNEFE: IBGE anticipates address registration microdata to assist managers in Rio Grande do Sul

CNEFE: IBGE anticipates address registration microdata to assist managers in Rio Grande do Sul The IBGE released, this Tuesday (21), in advance, the microdata from the National Register of Addresses for Statistical Purposes (CNEFE). The measure is another effort by the Institute to make available, as quickly as possible, information that can help with the calamity situation faced by Rio Grande do Sul. Full disclosure will be on June 14th.

In February, IBGE had already released the Geographic Coordinates of the Address Species of the 2022 Demographic Census. The novelty of this release is the information on the complete addressing attributes of the more than 106 million addresses collected, in accordance with the standard used by IBGE, including street, number and modifier, complement, location, zip code, type of unit visited, type of building, names of establishments, among others. The data dictionary was also made available with the characterization of the content and a document with guidelines for use due to this anticipation.

The CNEFE is made up of data from the entire country, but the idea of ​​bringing forward the release by a few weeks is to offer a great source of information to enrich and increase the work of managers, technicians and professionals who are working in Rio Grande do Sul.

The director of research at IBGE, Elizabeth Belo Hypolito, highlights the commitment of the entire Institute in supporting the Federal, State and municipal governments “IBGE has been constantly meeting to discuss actions that can assist in the work in Rio Grande do Sul. The boards and the State Superintendence are making a joint effort. And this anticipation of CNEFE microdata was one of the measures we managed to make viable”, he reinforces.

For the director of Geosciences, Ivone Lopes Batista, “the disclosure of addresses collected in the 2022 Demographic Census will allow the georeferencing of official records that enable the identification, for example, of vulnerable populations, and help support the reconstruction of affected areas in Rio Grande southern”.

Eduardo Baptista, registry manager, highlights the importance of disclosing microdata. “It will be possible to carry out a broad analysis of the affected addresses, aiming to serve society in providing support to the affected people and in planning the restoration of places that will need to be rebuilt”, he states. The information can be consulted in table files or exploration platforms for manipulating geographic data. “In addition to analyzing data from CNEFE itself, the user will be able to cross-reference the data with other databases existing in public and private institutions, such as registries of neighborhoods and affected locations from city halls and the State Government”, explains Baptista.

The full disclosure of the CNEFE will be on June 14th, when complementary materials with methodological notes and files with CNEFE data aggregated by CEP will be made available. The data can be downloaded or explored through IBGE’s data visualization platforms - on the 2022 Demographic Census hotsite and on the Interactive Geographic Platform (PGI).

In case of doubt, telephone support (0800 721 8181) is available, as well as Contact Us and other channels found in the Customer Service area of ​​the IBGE website, which can be accessed by clicking here. ##Dados para Dowloads https://www.ibge.gov.br/estatisticas/sociais/populacao/38734-cadastro-nacional-de-enderecos-para-fins-estatisticos.html?edicao=40122&t=resultados

Tables - Demographic Census 2022

Microdata files per UF (csv)

Microdata files by municipality (csv)

Dictionary (xls) Technical note nº 01/2024: Guidelines for using microdata from the National Register of Addresses for Statistical Purposes (CNEFE)

Download data from the 2022 Census - IBGE https://www.ibge.gov.br/estatisticas/sociais/populacao/38734-cadastro-nacional-de-enderecos-para-fins-estatisticos.html?edicao=40122&t=resultados

Download data from the 2022 IBGE Census. https://umbraosm.com.br/base-de-dados-ibge/

Access our website; www.umbraosm.com.br

Location: -15,801, -47,854
Posted by NitaRae on 24 May 2024 in English.

The NCST, in it’s current configuration, extends from a quasi center point of Wilcox Junction east to Trenton FL, west to Cross City FL, and south to Chiefland FL. All three of those terminal points have expansion plans when funding becomes available: Trenton east to Newberry FL (which connects it to Gainesville), Cross City northwest to Perry FL (and then probably on to Madison), Chiefland southeast to Dunellon FL (and the various trails currently operating in/around Citrus county).

While the trail itself is documented and mapped, there are many undocumented access points. Those access points lead to local small streets, residences, and often to local businesses. I am attempting to document those access points, so that bike riders (such as myself) can find safer ways to travel to those businesses.

The Florida Department of Transportation is working on road upgrades in my local area. Those upgrades (State Road 26 and US Highway 19/98) will include paved shoulders outside the travel lane marker line. Those shoulders allow for use by vehicles with breakdowns and for bicycles (although such use should be considered carefully in light of the speed of vehicles on the highway).

Location: 29.611, -82.941
Posted by rtnf on 24 May 2024 in English.

The key cuisine=* is used to describe the type of food served at a place. The cuisine tag is used on amenity=restaurant, amenity=fast_food, or amenity=cafe to provide more information about the type of food served.

The value can describe the ethnic origin of the food, specific types of food featured, or other features about the food or style of food.

Ethnic Origin
chinese
italian
mexican
japanese
american
indian
asian
thai
french
greek
german
korean
tex-mex 
vietnamese
turkish
spanish
mediterranean
lebanese
georgian
indonesian
portuguese
filipino
african
polish
arab
malaysian
peruvian
caribbean
russian
brazilian 
british
bavarian
taiwanese
persian
middle_eastern
argentinian
balkan
moroccan
hawaiian
oriental
Specific Types of Food
pizza
burger
coffee_shop
sandwich
chicken
kebab
sushi
ice_cream
seafood
steak_house
fish_and_chips 
noodle
barbecue
bubble_tea
ramen
juice
donut
fish
friture 
crepe
beef_bowl
wings 
hot_dog 
tapas 
cake
bagel  
pasta
salad
frozen_yogurt
tacos
dumplings 
soba
grill 
curry
steak
tea
pretzel
coffee
pancake
shawarma
sausage
hotpot
Other Features About The Food or Style of Food.
heuriger 
diner 
buschenschank 
bistro 

breakfast
dessert

regional 
international 
local

Values can be combined using the semi-colon value separator. For example, cuisine=donut;coffee_shop denotes a place that specializes in both donuts and coffee, or cuisine=italian;pizza denotes an Italian restaurant that specializes in pizza.

donut;coffee_shop
ice_cream;burger
italian;pizza
sandwich;bakery
pizza;italian
kebab;pizza
breakfast;pancake
italian_pizza
pizza;kebab
western;japanese
japanese;sushi
noodle;ramen
pizza;regional
ice_cream;bubble_tea
pizza;burger
italian;regional
chicken;portuguese
coffee_shop;sandwich
regional;pizza
american;breakfast
burger;sandwich
american;steak
burger;pizza
burger;chicken
regional;italian
pizza;pasta
german;regional

The order is not important. (DUBIOUS : DISCUSS)

It is important to use existing values when possible to assist third party tools. However, other values may be used if they are meaningful. For example, if a restaurant specializes in a local dish, it is appropriate to tag that even if the tag does not have widespread global use.

Values should be all lower case, even when listing ethnicities or other proper nouns which would usually have the first letter capitalized. Values are usually singular (cuisine=burger not cuisine=burgers).

Notes
  1. All the quoted passages are taken directly from the OSM Wiki.
  2. All the examples above are taken from taginfo, sorted largest to smallest, with a minimum occurrence threshold of 602.
  3. Why 602 you ask? No particular reason at all. I just gave up summarizing everything from taginfo around that number.

Maps are invaluable tools that serve a multitude of purposes across various aspects of life. At their core, maps provide spatial context, allowing individuals and organizations to understand the geography of an area and make informed decisions. They are crucial for navigation, helping people and goods move efficiently from one place to another by providing clear and precise routes. This is vital not only for everyday travel but also for logistics and supply chain management, where accurate mapping can significantly reduce costs and improve delivery times.

Beyond navigation, maps are essential for planning and development. Urban planners, architects, and engineers rely on maps to design cities, infrastructure, and buildings. They help identify the best locations for new developments, assess the environmental impact of projects, and plan for future growth in a sustainable manner. Maps also play a crucial role in public health by identifying disease hotspots, tracking the spread of epidemics, and planning healthcare services. In agriculture, maps are used to monitor crop health, manage resources, and improve yields through precision farming techniques.

Maps are also powerful tools for communication and education. They can convey complex information in a visual and easily understandable format, making them invaluable for teaching geography, history, and science. Maps help in visualizing data trends, such as population growth, economic activity, and environmental changes, enabling policymakers and researchers to analyze and address various issues effectively. Furthermore, maps promote transparency and accountability in governance by providing citizens with accessible information about their communities and the broader world. Overall, the value of a map extends far beyond its basic function of showing locations; it is a fundamental resource for decision-making, planning, and understanding our world.

But, What If You Don’t Have Access To A Map?

How often do you use maps each day? Perhaps, like me, you use them in getting to and from work each day (you know how to get there, but still like to know traffic updates, duration and so forth), facebook marketplace locations, checking the status of your Amazon packages, or finding new restaurants to try, or fun things to do near you.

What about more serious situations - the closest hospital, emergency room or police station, the local evacuation route, or even navigating through unfamiliar neighborhoods during a natural disaster.

Maps are indispensable tools in our daily lives, guiding us through both mundane tasks and critical situations, ensuring we reach our destinations safely and efficiently while providing vital information for decision-making in times of need.

Lack of access to accurate and up-to-date maps in developing or undeveloped countries has far-reaching implications across various sectors. Firstly, in emergency response scenarios, the absence of reliable maps poses significant challenges. This hampers the effectiveness of rescue operations in disaster-prone regions, hindering timely assistance to affected populations due to the lack of clear routes and local geography knowledge. Consequently, lives are at stake as emergency teams struggle to navigate through affected areas, exacerbating the impact of natural disasters.

Moreover, the absence of accurate maps impedes development planning efforts. Urban planning and infrastructure development become inefficient without detailed geographic information, leading to suboptimal public services such as inadequate water supply, electricity, and transportation networks. Additionally, healthcare delivery is compromised as health workers face difficulties in tracking disease outbreaks, managing vaccination campaigns, and planning healthcare facility construction in remote areas, ultimately resulting in unequal access to healthcare services and inefficient resource allocation.

However, initiatives like HOT are instrumental in addressing these challenges. By promoting open geographic data and community-based mapping projects, HOT enhances the resilience and development of communities lacking access to reliable maps. These efforts not only facilitate emergency response and development planning but also support environmental management, economic growth, education, and legal clarity, thereby fostering sustainable development in regions with limited mapping resources.